
Gallery
Description
GlymeraProfiler
Which plugin is slowing down your Hytale server? Find out in 30 seconds — right in
your browser. Local only: it never opens a port and never sends anything anywhere.
GlymeraProfiler samples your server's threads many times per second, works out which
plugin (or the engine) is actually running, and turns it into a clear, per-plugin CPU
breakdown. Everything — dashboard, data and flame graph — is baked into a single HTML
file you open in any browser. No web server, no account, no setup.
How to use
- Drop the jar into your server's
mods/folder. - In-game as an operator, run
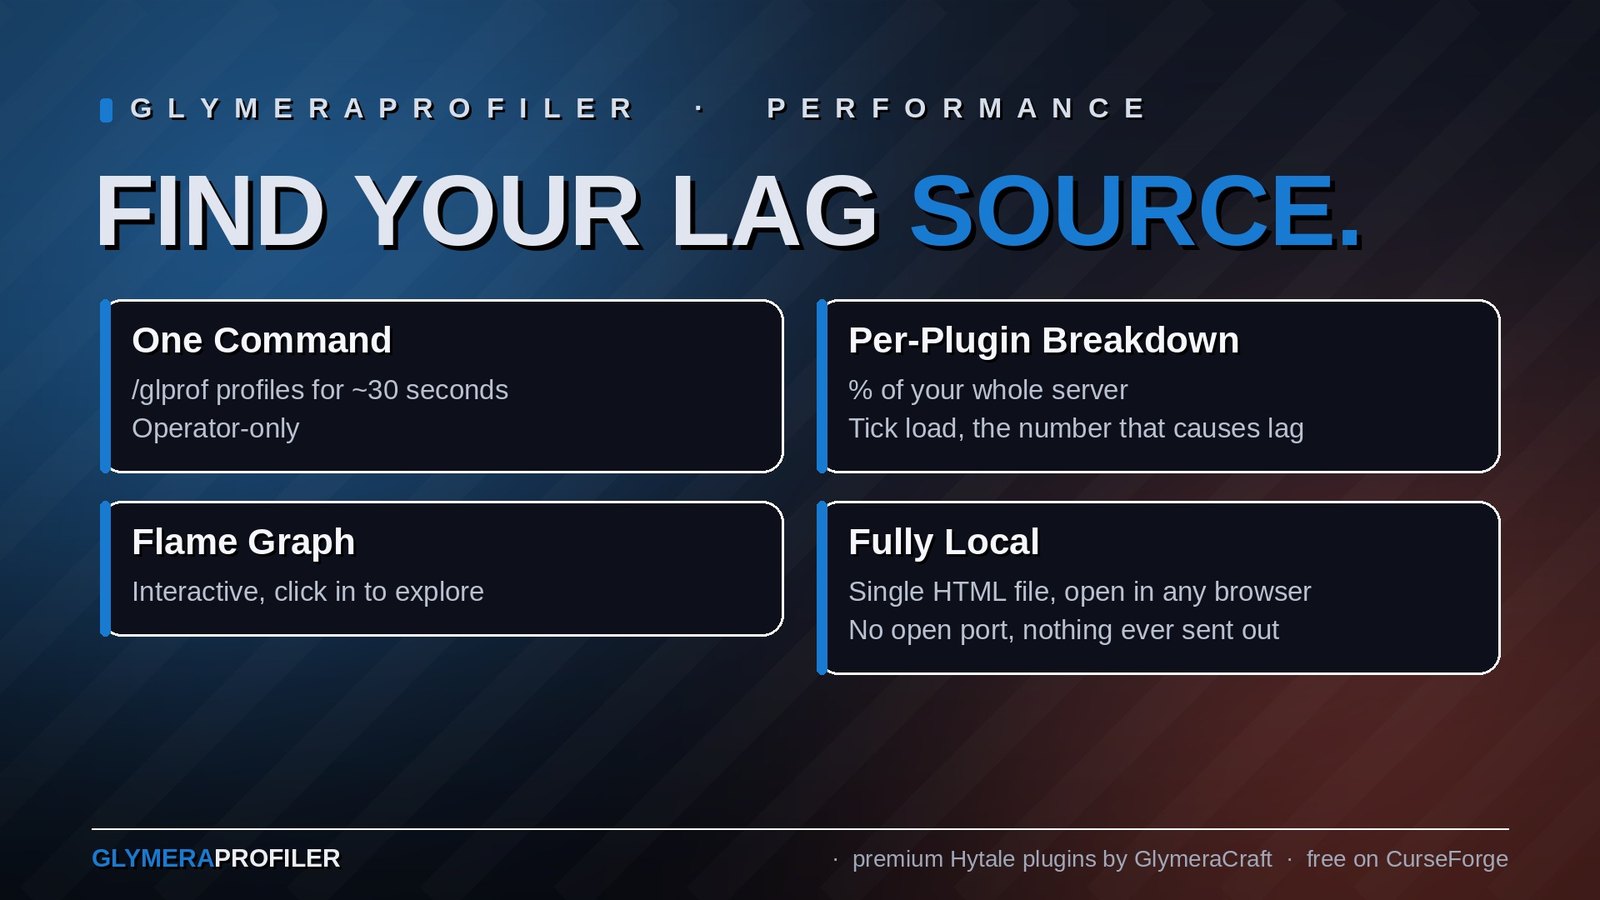
/glprof. It profiles for ~30 seconds and writes a
report.htmlintomods/de.glymera_GlymeraProfiler/. - Download that file (hosting panel / FTP) and open it in any browser. Done — no
ports, no firewall, no config.
What you get
- CPU-capacity bar — the whole bar is your server (all cores); see at a glance how
much is in use and how much is spare. - Per-plugin table — each plugin's % of your whole server, raw CPU (ms/s), and
Tick load: how hard it pushes the game's single main thread — the number that
actually causes lag, even when other cores sit idle. - Plain-English explanations on every section — written for server owners, not just
developers. - History graphs — server load (as a share of total capacity) and the plugin mix
over time. - Interactive flame graph — click in to see exactly where the busy time went.
- The profiler's own cost, shown openly (roughly 1 % of a single core).
Privacy & safety
The report is a plain local HTML file. It contains everything it needs, loads nothing
from the internet, and the plugin opens no network ports — no uploads, no
phone-home, nothing ever leaves your server. Safe to run on a live server: tiny
footprint (about 1 % of one CPU core) and operator-only.
Configuration
mods/de.glymera_GlymeraProfiler/config.json:
reportSeconds— capture length for/glprof(default30).sampleIntervalMs— sampling period (default100= 10 Hz); lower it for finer detail.historySeconds,flameMaxNodes,flameMaxDepth,enabled.
Good to know
- It's a sampling profiler: numbers are statistical, accurate to within a few
percent — perfect for spotting which plugin is heavy. /glprofis operator-only; a normal player cannot trigger a report.
Plugin data folder: mods/de.glymera_GlymeraProfiler/
Changelog
GlymeraProfiler — Changelog
v3.0.0 (2026-08-28) — Hytale 0.6.0 (Update 6)
- Rebuilt for Hytale 0.6.0 (Update 6). Requires server 0.6.0 or newer; this version does not run on 0.5.x, and older versions of this plugin do not run on 0.6.0.
- Migrated to the 0.6.0 APIs (network protocol hytale/3, new command-permission API, block/chunk/entity API changes). Everything that was open to players before is open to players again.
- Upgrade: delete the old jar from
mods/, drop in the new one and keep the plugin's data folder — configs and saved data carry over unchanged. Restart the server.
v2.0.0 — 2026-05-30
Clearer reporting: the report now shows how much of your server's total CPU each
plugin uses, in plain language for non-technical server owners.
New
- "% of server" per plugin — each plugin's share of your whole machine (all CPU
cores = 100%). This is the headline "what does it cost" number.
- "Tick load" column (was "% of a core") — how hard a plugin pushes the game's
single main thread; near 100% it can lag the game even while other cores sit idle.
- CPU-capacity bar at the top — the whole bar is your server (all cores); coloured
segments are the plugins + engine, the striped tail is spare (free) capacity.
- "CPU cores" and "In use" cards, plus a short plain-English explanation on every
section.
- The server-load history graph is now drawn as a share of total server capacity, with
the empty top showing spare headroom.
No change to how it works: still a local-only sampling profiler, still writes a single
self-contained report.html, still opens no port and sends nothing anywhere.
v1.0.0 — 2026-05-30
Initial release. A sampling CPU profiler that shows how much compute each plugin
uses. Local-only by design — it never opens a port and never sends anything
anywhere.
How you view it
- /glprof (OP-only) captures a ~30 s profile and writes a single self-contained
report.html into the plugin's data folder. Download it (hosting panel / FTP)
and open it in any browser. The file contains the dashboard + data + flame graph;
it loads nothing from the internet and sends nothing anywhere.
Engine
- Stack-samples every active server thread (10 Hz by default) and attributes each
sample to a plugin (by package), the engine, idle, or the profiler itself.
- Idle detection via thread state plus native I/O-wait patterns
(epoll/select/accept), so blocked network threads are never counted as load.
- Reads real tick length / TPS, heap, and player/world counts. Bounded call tree
backs the flame graph.
- Measures its own overhead (~0.9 % of one core at 10 Hz on a ~50-thread server)
and shows it in the report.
Report contents
- Per-plugin table (CPU ms/s, % of a core, % of total), header cards, server-load
history, plugin-mix history, and an interactive flame graph.
Config — mods/de.glymera_GlymeraProfiler/config.json
- enabled, reportSeconds (30), sampleIntervalMs (100 = 10 Hz), windowMs,
historySeconds, flameMaxNodes, flameMaxDepth.
Notes
- The sampling/attribution engine is derived from the internal GlymeraPerf tool;
the in-game HUD was dropped in favour of the browser report.
- No network of any kind — no listening socket, no outbound connection.
- Sampling is statistical (accurate within a few %). Lower sampleIntervalMs for
finer detail at slightly higher cost.
Only Marc can read this.